Mastering Trading with AutoML: Your Guide to Profitable Algorithmic Strategies
Automated Machine Learning (AutoML) plays a crucial role in crafting trading strategies driven by algorithms. In this tutorial, we’re going to walk you through AutoML, why it’s a game-changer in trading, and get you acquainted with two awesome AutoML tools, TPOT and H2O.ai.

AutoML takes care of all the stuff like handling data, tweaking features, choosing the best model, and fine-tuning parameters. Essentially, it’s the magic behind automating the most time-consuming parts of building machine learning models.
AutoML uses fancy algorithms and clever tricks to automatically search, test, and optimize machine learning models, making your life as a developer a whole lot easier. With AutoML at your side, you can focus on the exciting stuff, like defining the problem and tailoring features to your specific domain.
Benefits of AutoML in Algorithmic Trading
Algorithmic trading involves the use of computer algorithms to execute trading strategies based on predefined rules. Developing effective trading strategies requires extensive data analysis, feature engineering and model selection. AutoML can significantly streamline this process and offer several benefits:
- Time Efficiency: AutoML automates time-consuming tasks, such as data preprocessing and hyperparameter tuning, allowing traders to focus on strategy formulation and evaluation.
- Improved Performance: AutoML algorithms can explore a wide range of models and hyperparameters, leading to improved performance compared to manual model selection.
- Reduced Bias: AutoML techniques eliminate human bias in model selection and hyperparameter tuning, leading to more objective and robust trading strategies.
- Scalability: AutoML can handle large datasets and complex feature spaces, enabling traders to develop strategies that capture intricate market dynamics.
Popular AutoML Tools for Algorithmic Trading
There are several AutoML tools available that can be leveraged for algorithmic trading strategy development. In this tutorial, we will focus on two popular tools: TPOT and H2O.ai.
TPOT
TPOT (Tree-based Pipeline Optimization Tool) is an open-source AutoML library that uses genetic programming to optimize machine learning pipelines. It automatically explores a large search space of possible pipelines, including data preprocessing steps, feature selection and model selection.
H2O.ai
H2O.ai is another powerful AutoML platform that provides a range of automated machine learning capabilities. It offers an intuitive interface for building and deploying machine learning models, including support for time series analysis and algorithmic trading.
Setting up the Environment
Before we dive into the implementation of AutoML techniques for algorithmic trading strategy development, let’s set up our Python environment and install the necessary libraries.
Installing Required Libraries
To get started, we need to install the following libraries:
- numpy
- pandas
- yfinance
- tpot
- h2o
You can install these libraries using pip:
!pip install numpy pandas yfinance tpot h2oImporting Required Libraries
Once the libraries are installed, we can import them into our Python script:
import numpy as np
import pandas as pd
import yfinance as yf
from tpot import TPOTClassifier
import h2o
from h2o.automl import H2OAutoML
Data Acquisition and Preprocessing
Now, we will acquire financial data using the yfinance library and preprocess it for algorithmic trading strategy development.
We will use the yfinance library to fetch historical financial data specifically for the ‘JPM’ (JPMorgan Chase & Co.) stock ticker. Let’s set the date range for this data retrieval:
tickers = ['JPM']
start_date = '2018-01-01'
end_date = '2023-08-31'

data = yf.download(tickers, start=start_date, end=end_date)
Once we have the financial data, we need to preprocess it before feeding it into the AutoML models. Let’s perform some basic preprocessing steps:
# Remove missing values
data = data.dropna()

# Calculate daily returns
data['Return'] = data['Close'].pct_change()

# Calculate moving averages
data['MA_50'] = data['Close'].rolling(window=50).mean()
data['MA_200'] = data['Close'].rolling(window=200).mean()

# Create target variable
data['Target'] = np.where(data['Return'] > 0, 1, 0)

# Split data into training and testing sets
train_size = int(len(data) * 0.8)
train_data = data[:train_size].copy()
test_data = data[train_size:].copy()
We will use the TPOT library to automatically generate and optimize trading strategies.
Defining the Problem
Before we can use TPOT, we need to define the problem we want to solve. In this case, our goal is to predict whether the daily return of a stock will be positive or negative based on historical data.
Training the TPOT Model
Let’s train the TPOT model using the training data:
# Separate features and target variable
X_train = train_data[['MA_50', 'MA_200']]
y_train = train_data['Target']

# Initialize TPOT classifier
tpot = TPOTClassifier(generations=10, population_size=50, verbosity=2)

# Train the model
tpot.fit(X_train, y_train)
Once the model is trained, we can evaluate its performance on the testing data:
# Separate features and target variable
X_test = test_data[['MA_50', 'MA_200']]
y_test = test_data['Target']

# Evaluate the model
accuracy = tpot.score(X_test, y_test)
print(f"Accuracy: {accuracy}")
Accuracy: 0.524390243902439Generating the Trading Strategy
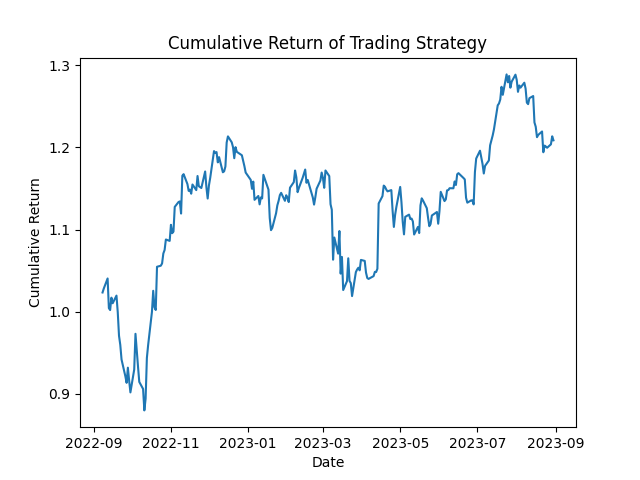
We will generate as an example a trading strategy based on the TPOT model’s predictions:
# Make predictions on the testing data
predictions = tpot.predict(X_test)

# Create trading signals based on the predictions
test_data.loc[:, 'Signal'] = np.where(predictions == 1, 1, -1)

# Calculate daily returns of the trading strategy
test_data.loc[:, 'Strategy_Return'] = test_data['Signal'] * test_data['Return']

# Calculate cumulative returns
test_data['Cumulative_Return_TPOT'] = (1 + test_data['Strategy_Return']).cumprod()

# Plot the cumulative returns
import matplotlib.pyplot as plt

plt.plot(test_data['Cumulative_Return_TPOT'])
plt.xlabel('Date')
plt.ylabel('Cumulative Return')
plt.title('Cumulative Return of Trading Strategy')
Using H2O.ai for Strategy Development
We will now explore the H2O.ai library and its AutoML capabilities for algorithmic trading strategy development.
Before we can use H2O.ai, we need to initialize the H2O cluster:
h2o.init()H2O.ai requires data to be in the H2O Frame format. Let’s convert our training and testing data to H2O Frames:
# Convert training data to H2O Frame
train_h2o = h2o.H2OFrame(train_data)

# Convert testing data to H2O Frame
test_h2o = h2o.H2OFrame(test_data)
Training the H2O AutoML Model
Let’s train the H2O AutoML model using the training data:
# Define features and target variable
features = ['MA_50', 'MA_200']
target = 'Target'

# Train the AutoML model
aml = H2OAutoML(max_models=20, seed=1)
aml.train(x=features, y=target, training_frame=train_h2o)
Once the model is trained, we can evaluate its performance on the testing data:
# Evaluate the model
leaderboard = aml.leaderboard
print(leaderboard)
model_id auc logloss aucpr mean_per_class_error rmse mse
DeepLearning_grid_3_AutoML_1_20230903_212353_model_1 0.532714 0.698202 0.517747 0.5 0.502349 0.252354
GLM_1_AutoML_1_20230903_212353 0.532598 0.69102 0.508643 0.498992 0.498938 0.248939
DeepLearning_grid_2_AutoML_1_20230903_212353_model_1 0.532129 0.695525 0.517005 0.5 0.50097 0.250971
DeepLearning_grid_3_AutoML_1_20230903_212353_model_2 0.516846 0.693306 0.50998 0.49496 0.500078 0.250078
XRT_1_AutoML_1_20230903_212353 0.514925 0.859604 0.512393 0.49496 0.551758 0.304437
DeepLearning_grid_1_AutoML_1_20230903_212353_model_2 0.514667 0.700916 0.508606 0.498009 0.503654 0.253667
DRF_1_AutoML_1_20230903_212353 0.511943 0.970723 0.516976 0.5 0.560415 0.314065
GBM_5_AutoML_1_20230903_212353 0.51122 0.711706 0.489317 0.5 0.508239 0.258307
DeepLearning_grid_1_AutoML_1_20230903_212353_model_1 0.510156 0.698407 0.505102 0.5 0.502529 0.252536
GBM_grid_1_AutoML_1_20230903_212353_model_2 0.506711 0.705076 0.490292 0.497001 0.505595 0.255626
[22 rows x 7 columns]Generating the Trading Strategy
Let’s generate the trading strategy based on the H2O AutoML model’s predictions:
# Make predictions on the testing data
predictions = aml.predict(test_h2o)

# Created DF from predictions h20frame
predictions_df  = predictions.as_data_frame()

# Create trading signals based on the predictions
test_data.loc[:, 'Signal'] = np.where(predictions_df['predict'] == '1', 1, -1)

# Calculate daily returns of the trading strategy
test_data['Strategy_Return'] = test_data['Signal'] * test_data['Return']

# Calculate cumulative returns
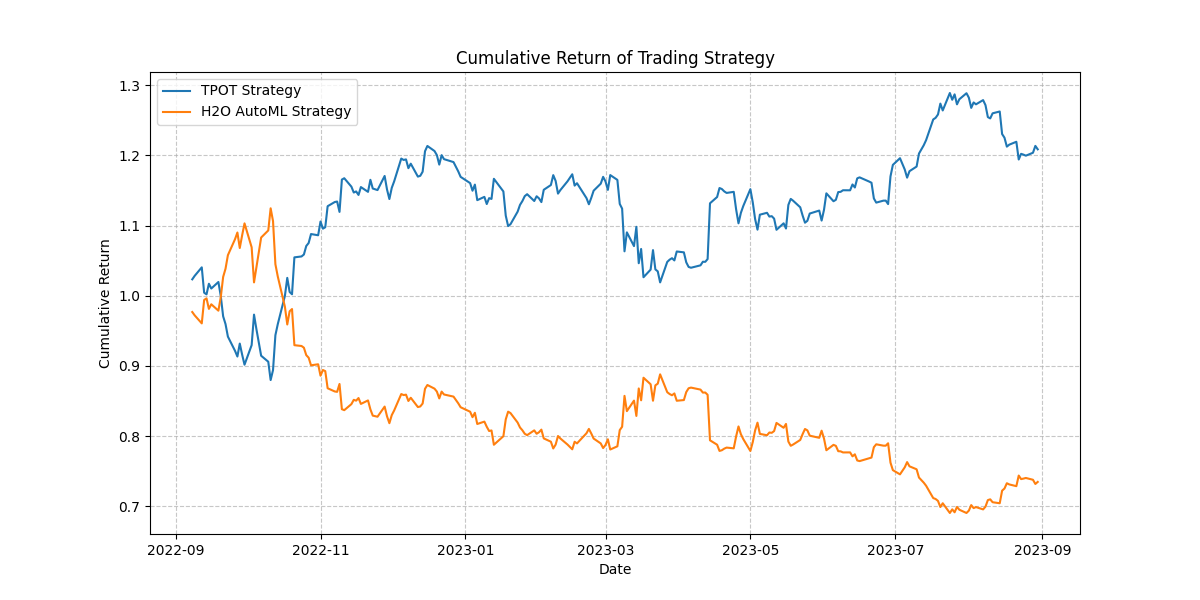
test_data['Cumulative_Return_H2O'] = (1 + test_data['Strategy_Return']).cumprod()

# Plot the cumulative returns
import matplotlib.pyplot as plt

plt.figure(figsize=(12, 6))
plt.plot(test_data[['Cumulative_Return_TPOT', 'Cumulative_Return_H2O']])
plt.xlabel('Date')
plt.ylabel('Cumulative Return')
plt.title('Cumulative Return of Trading Strategy')
plt.grid(True, linestyle='--', alpha=0.7)
plt.legend(['TPOT Strategy', 'H2O AutoML Strategy'])
Conclusion
In this tutorial, we explored the concept of AutoML and its relevance in algorithmic trading strategy development. We discussed the benefits of using AutoML techniques and introduced two popular tools, TPOT and H2O.ai. to automatically generate and optimize trading strategies.
By leveraging AutoML techniques, traders can streamline the strategy development process, improve performance and reduce bias. AutoML tools like TPOT and H2O.ai provide powerful capabilities for developing robust and profitable trading strategies.
Remember to experiment with different features, models and hyperparameters to further enhance the performance of your trading strategies.
Become a Medium member today and enjoy unlimited access to thousands of Python guides and Data Science articles! For just $5 a month, you’ll have access to exclusive content and support as a writer. Sign up now using my link and I’ll earn a small commission at no extra cost to you.

References
- TPOT Documentation: https://epistasislab.github.io/tpot/
- H2O.ai Documentation: https://docs.h2o.ai/
