Real-time Risk Management in Algorithmic Trading: Strategies for Mitigating Exposure
In the fast-paced world of algorithmic trading, managing risk in real-time is crucial for success. By implementing effective risk management strategies, traders can mitigate exposure to potential losses and maximize profits. In this advanced Python tutorial, we will delve into the intricacies of real-time risk management in algorithmic trading.
We will explore how Python can be used to process real-time data, implement risk management protocols, predict and mitigate risks using machine learning models and ultimately build a robust real-time risk management system for algorithmic trading.
Table of Contents
- Introduction: Setting the stage for the importance of real-time risk management in algorithmic trading.
- Understanding Algorithmic Trading: Delving into the basics of algorithmic trading and its significance in the financial world.
- Real-time Data Processing with Python: Exploring how Python can be utilized for processing real-time data in algorithmic trading.
- Implementing Risk Management Strategies: Techniques for integrating risk management protocols into algorithmic trading algorithms.
- Utilizing Machine Learning for Risk Prediction: Leveraging machine learning models to predict and mitigate risk in real-time trading scenarios.
- Building a Real-time Risk Management System: Step-by-step guide on developing a robust risk management system using Python for algorithmic trading.
- Conclusion: Summarizing the key points and emphasizing the importance of effective risk management practices in algorithmic trading.
Introduction
In algorithmic trading, where automated systems execute trades at high speeds, the ability to manage risks in real-time can make the difference between profit and loss. Real-time risk management involves continuously monitoring and adjusting trading strategies to limit exposure to adverse market conditions and unforeseen events. By leveraging Python’s flexibility and powerful libraries, traders can develop sophisticated risk management systems that enhance trading performance and safeguard investments.
Understanding Algorithmic Trading:
Algorithmic trading, also known as algo trading, is the process of using computer programs to execute trading strategies with speed and efficiency. This type of trading relies on predefined criteria or algorithms to make buying or selling decisions in financial markets. Algorithmic trading has revolutionized the way trades are executed, allowing for rapid transactions and increased accuracy compared to human decision-making.
In the financial world, algorithmic trading plays a significant role in providing liquidity to markets, reducing transaction costs and increasing efficiency. Traders can capitalize on small price discrepancies and opportunities in the market that would be challenging to exploit manually. By automating the trading process, algorithmic trading enables traders to react quickly to changing market conditions and execute trades at optimal prices.
To better understand the concept of algorithmic trading, let’s take a practical approach by using Python to download and analyze real-world financial data. In the following code snippet, we will use the yfinance library to download historical stock data for a well-known ticker symbol, 'AAPL' (Apple Inc.) and display the first few rows of the dataset.
import pandas as pd
import yfinance as yf

# Download data for a real-world financial ticker
ticker = yf.Ticker("AAPL")
data = ticker.history(period="1y")

# Display the first few rows of the data
print(data.head())
Running the code above will output a table showing the Open, High, Low, Close, Volume, Dividends and Stock Splits columns for the ‘AAPL’ stock data over the past year. This information provides valuable insights into the historical price movements of the stock, which can be used to inform trading strategies and decisions.
Real-time Data Processing with Python
Real-time data processing is essential in algorithmic trading to react promptly to market changes and execute trading decisions efficiently. Python, with its diverse libraries and powerful capabilities, serves as an excellent tool for processing and analyzing real-time data in trading scenarios. In this section, we will further explore how Python can be leveraged for real-time data processing in algorithmic trading.
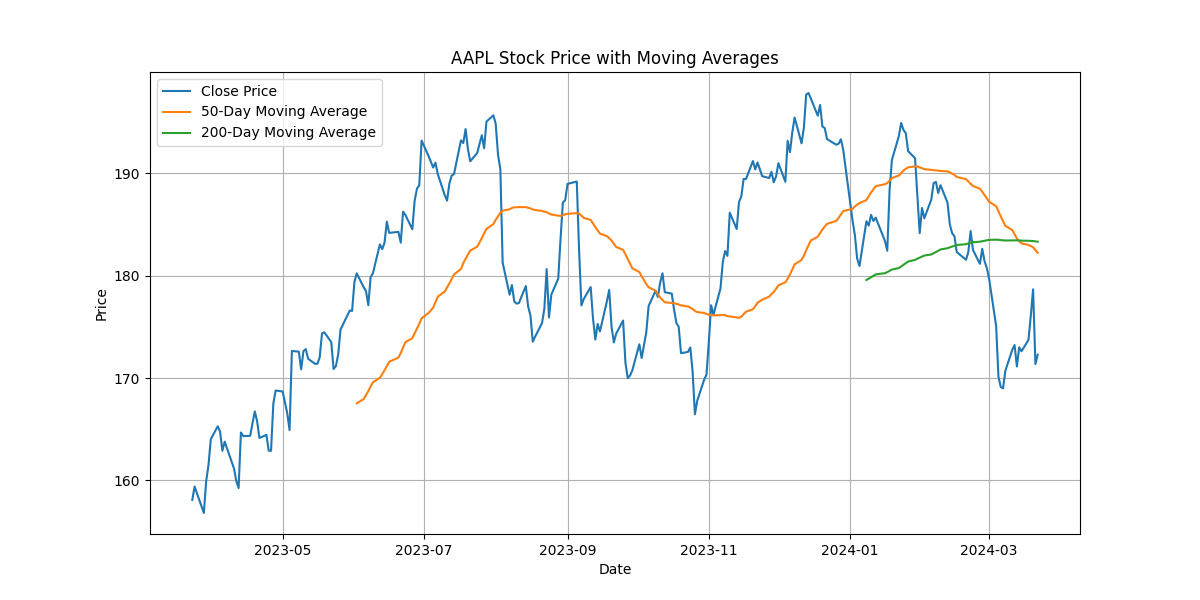
To begin, let’s continue working with the historical stock data of the ‘AAPL’ ticker that we downloaded in the previous section. We will perform additional data processing and analysis, including calculating moving averages for the closing price to visualize trends in the stock price.
import matplotlib.pyplot as plt

# Calculating moving averages for visualization
data['MA_50'] = data['Close'].rolling(window=50).mean()
data['MA_200'] = data['Close'].rolling(window=200).mean()

# Plotting the closing price along with moving averages
plt.figure(figsize=(12, 6))
plt.plot(data['Close'], label='Close Price')
plt.plot(data['MA_50'], label='50-Day Moving Average')
plt.plot(data['MA_200'], label='200-Day Moving Average')
plt.title('AAPL Stock Price with Moving Averages')
plt.xlabel('Date')
plt.ylabel('Price')
plt.legend()
plt.grid()
In the code snippet above, we calculate the 50-day and 200-day moving averages of the closing price of the ‘AAPL’ stock. These moving averages help smooth out price fluctuations and reveal underlying trends in the stock’s performance. Finally, we plot the closing price along with the moving averages to visualize how the stock price behaves over time.
Through real-time data processing and visualization with Python, traders can gain deeper insights into market trends and make informed decisions for their algorithmic trading strategies. Python’s versatility and efficiency enable traders to adapt quickly to changing market conditions and optimize their trading processes for better risk management and profitability.
Implementing Risk Management Strategies
Risk management is a fundamental aspect of successful algorithmic trading, as it helps traders mitigate potential losses and maximize profits. Integrating risk management strategies into trading algorithms is essential for maintaining a balanced risk-reward ratio and ensuring long-term profitability. In this section, we will explore how to implement risk management protocols using Python to enhance algorithmic trading strategies.
# Importing necessary libraries
import numpy as np

# Implementing risk management strategies
class RiskManagement:
    def __init__(self, data):
        self.data = data

    def calculate_volatility(self):
        self.data['Daily_Return'] = np.log(self.data['Close'] / self.data['Close'].shift(1))
        self.data['Volatility'] = self.data['Daily_Return'].rolling(window=50).std() * np.sqrt(252)

    def plot_volatility(self):
        plt.figure(figsize=(12, 6))
        plt.plot(self.data['Volatility'], color='orange', label='Volatility')
        plt.title('AAPL Stock Volatility')
        plt.xlabel('Date')
        plt.ylabel('Volatility')
        plt.legend()
        plt.grid()


# Using risk management class
risk_management = RiskManagement(data)
risk_management.calculate_volatility()
risk_management.plot_volatility()
The code above showcases a RiskManagement class that calculates the volatility of a stock based on its historical price data. By computing the daily returns and calculating the volatility using a rolling window, traders can gauge the risk associated with the stock’s price movements. The plot_volatility method visualizes the volatility over time, providing insights into the stock’s price fluctuation patterns.
Running the code will output a plot illustrating the volatility of the ‘AAPL’ stock, offering a glimpse into the level of risk associated with the stock’s price movements.
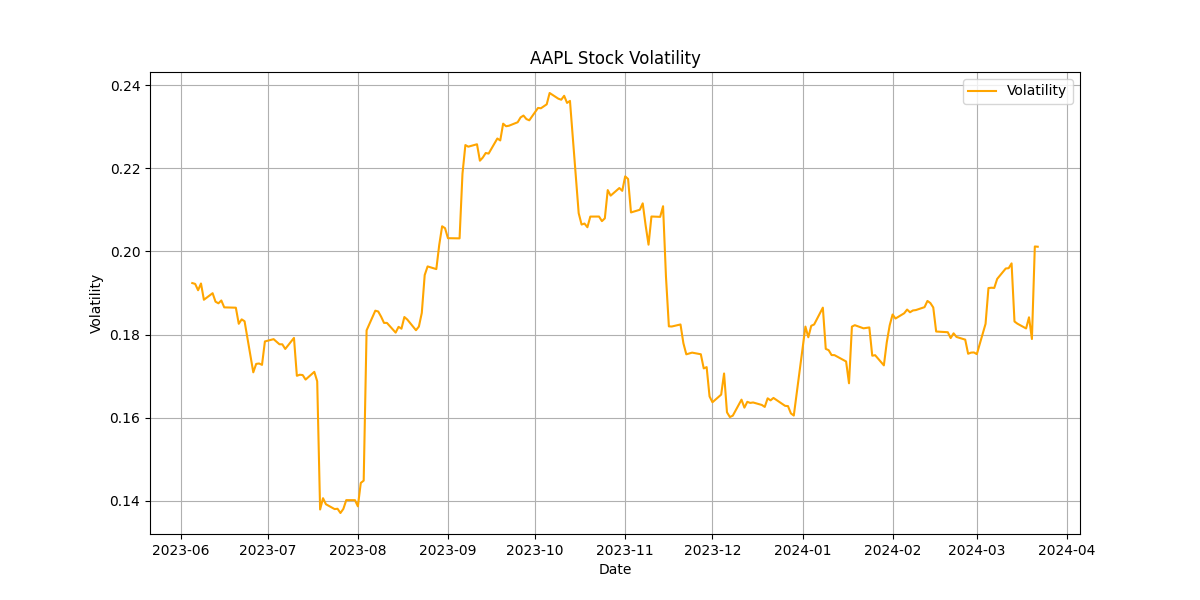
By implementing risk management strategies like volatility analysis, traders can make informed decisions, adjust their trading strategies and effectively manage risks in algorithmic trading. Python’s flexibility and data processing capabilities empower traders to develop robust risk management systems that enhance performance and optimize trading outcomes.
Utilizing Machine Learning for Risk Prediction
Risk prediction in algorithmic trading plays a crucial role in identifying potential risks and taking proactive measures to mitigate them. By leveraging machine learning models, traders can analyze historical data, detect patterns and predict price movements to manage risks effectively. In this section, we will delve into utilizing machine learning for risk prediction in real-time trading scenarios using Python.
# Importing necessary libraries
import numpy as np
import pandas as pd
import matplotlib.pyplot as plt
from sklearn.model_selection import train_test_split
from sklearn.ensemble import RandomForestClassifier
from sklearn.metrics import accuracy_score

# Utilizing Machine Learning for Risk Prediction
class RiskPrediction:
    def __init__(self, data):
        self.data = data
        self.X = None
        self.y = None
        self.model = None
        self.prediction = None
        self.y_test = None

    def prepare_data(self):
        self.data['Price_Direction'] = np.where(self.data['Close'].shift(-1) > self.data['Close'], 1, 0)
        self.data.dropna(inplace=True)
        self.X = self.data[['Open', 'High', 'Low', 'Close', 'Volume']]
        self.y = self.data['Price_Direction']
        self.X_train, self.X_test, self.y_train, self.y_test = train_test_split(self.X, self.y, test_size=0.2, random_state=42)

    def train_model(self):
        self.model = RandomForestClassifier()
        self.model.fit(self.X_train, self.y_train)
        self.prediction = self.model.predict(self.X_test)

    def evaluate_model(self):
        accuracy = accuracy_score(self.y_test, self.prediction)
        print(f"Accuracy: {accuracy}")

    def save_plot(self):
        plt.figure(figsize=(12, 6))
        plt.plot(self.data.index[-len(self.prediction):], self.prediction, label='Predicted Price Direction', color='green')
        plt.title('Price Direction Prediction')
        plt.xlabel('Date')
        plt.ylabel('Price Direction')
        plt.legend()
        plt.grid()


# Using risk prediction class
risk_prediction = RiskPrediction(data)
risk_prediction.prepare_data()
risk_prediction.train_model()
risk_prediction.evaluate_model()
risk_prediction.save_plot()
The code above introduces a RiskPrediction class that leverages a Random Forest classifier to predict the price direction in real-time trading scenarios. By preparing the data, training the model, evaluating its accuracy and saving a plot of the predicted price direction, traders can gain insights into potential risks and make informed decisions to manage them effectively.
When executed, the code will output the accuracy of the model in predicting price directions and save a plot illustrating the predicted price movements based on historical data.

By utilizing machine learning for risk prediction in algorithmic trading, traders can enhance their risk management strategies, identify potential risks and optimize trading decisions for improved performance and profitability. Python’s robust machine learning libraries empower traders to develop sophisticated risk prediction models that adapt to dynamic market conditions and contribute to successful trading outcomes.
Building a Real-time Risk Management System
In algorithmic trading, having a real-time risk management system is essential to monitor and adjust trading strategies promptly, minimizing potential losses and maximizing profitability. To build a robust risk management system using Python, we will create a RealTimeRiskManagement class that calculates drawdown and visualizes it for a given dataset. The drawdown represents the peak-to-trough decline during a specific trading period.
# Importing necessary libraries
import numpy as np
import pandas as pd
import matplotlib.pyplot as plt

# Building a Real-time Risk Management System
class RealTimeRiskManagement:
    def __init__(self, data):
        self.data = data

    def calculate_drawdown(self):
        self.data['High'] = self.data['Close'].cummax()
        self.data['Drawdown'] = (self.data['Close'] - self.data['High']) / self.data['High']

    def plot_drawdown(self):
        plt.figure(figsize=(12, 6))
        plt.plot(self.data['Drawdown'], color='red', label='Drawdown')
        plt.title('AAPL Stock Drawdown')
        plt.xlabel('Date')
        plt.ylabel('Drawdown')
        plt.legend()
        plt.grid()


# Using real-time risk management class
real_time_risk_management = RealTimeRiskManagement(data)
real_time_risk_management.calculate_drawdown()
real_time_risk_management.plot_drawdown()
The RealTimeRiskManagement class method calculate_drawdown computes the drawdown based on the close prices and the peak prices reached by the stock. Subsequently, the plot_drawdown method visually represents the drawdown over time for the 'AAPL' stock dataset. The resulting plot helps traders visualize periods of decline and better assess the risk associated with the trading asset.
Upon running the provided code section, a plot showcasing the drawdown of the ‘AAPL’ stock will illustrate the fluctuations in the stock price relative to the peaks.
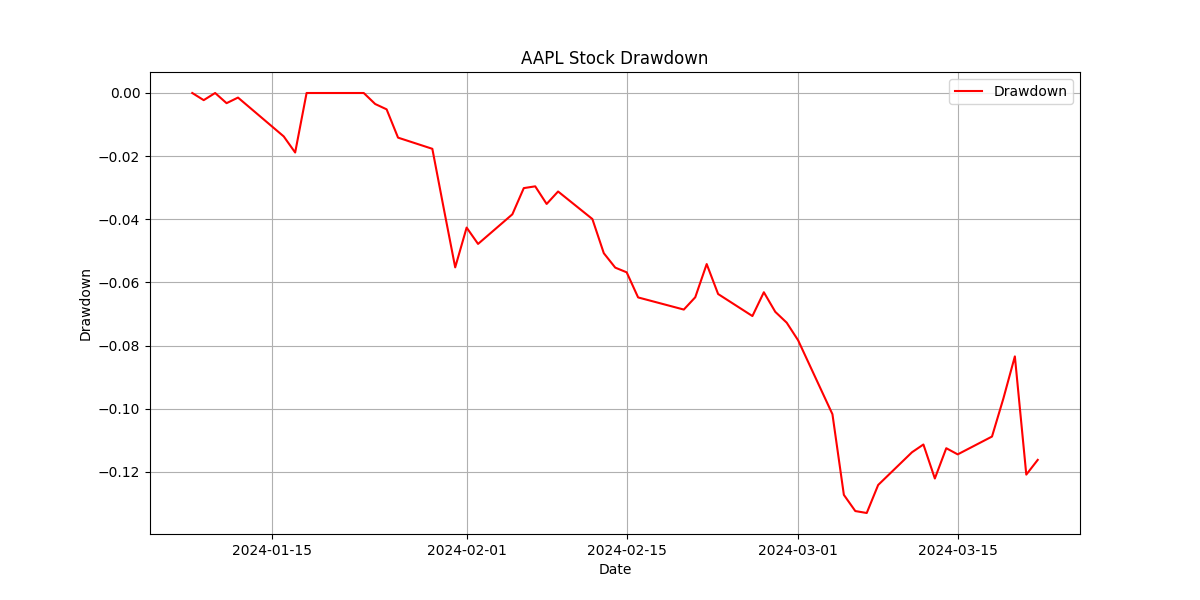
By incorporating a real-time risk management system using Python, traders can proactively identify potential risks, optimize trading strategies and enhance risk management practices in algorithmic trading for improved performance and profitability. The developed system enables traders to maintain a comprehensive view of risk exposure and make informed decisions to navigate volatile market conditions effectively.
Conclusion
Algorithmic trading is a big part of how the finance world works today, using clever methods to do trading. But one thing is super important here — managing risks to avoid big losses. By using up-to-the-minute data and machine learning, we can get better at predicting and handling these risks. It’s really important to build a strong system for managing risks to keep trading stable and profitable. Methods like figuring out how much prices might go up and down and measuring how much value an investment might lose can really help in keeping an eye on and dealing with risks.
Good risk management is key to doing well in algorithmic trading. It helps keep losses under control, makes sure profits are as high as possible, and keeps trading strategies working well over time.
In summary, managing risks well is super important in algorithmic trading. It’s what helps traders deal with the ups and downs of the financial markets, keep losses in check, and keep making money from their trading strategies over the long haul.